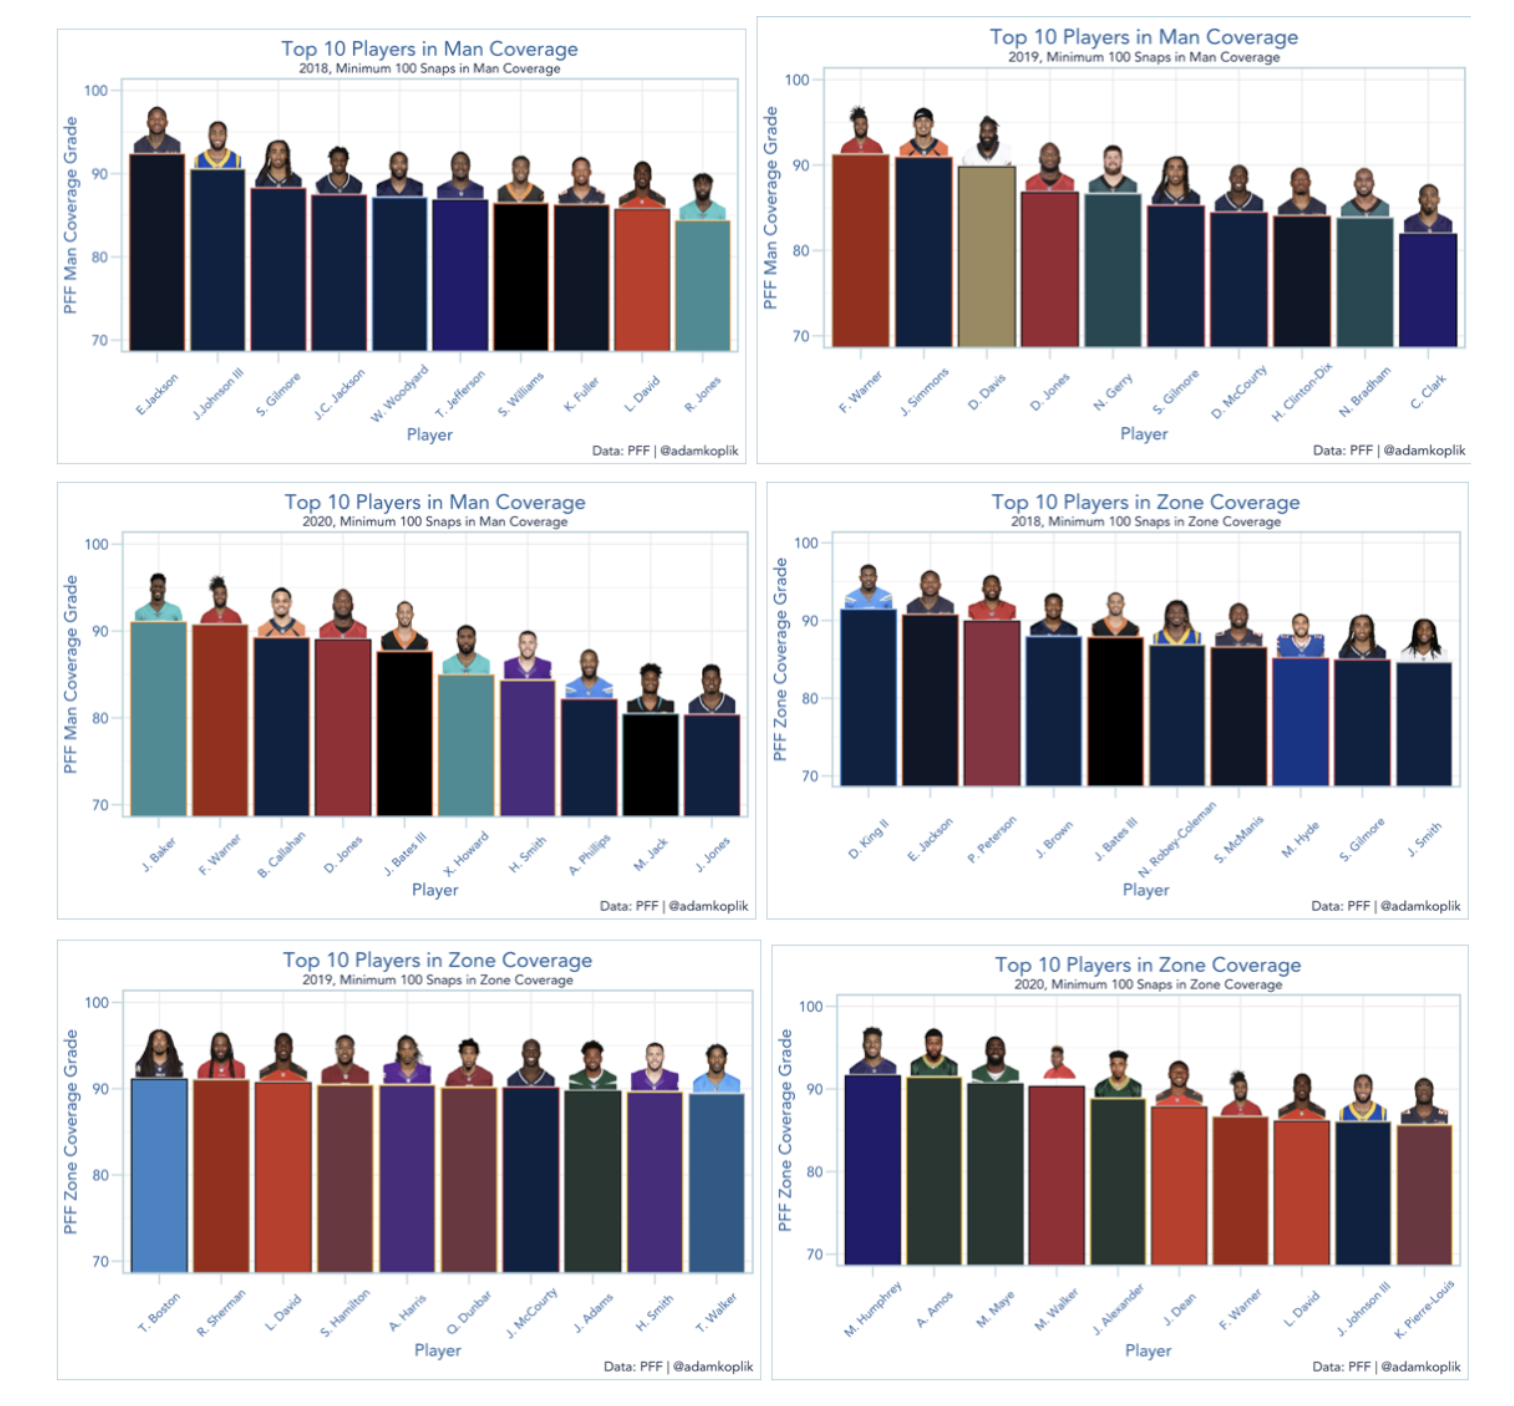
NFL Zone Coverage
Beating Zone Coverage: NFL Coverage Efficiency Analysis
By Adam Koplik and Ajay Patel
Overview
This was one of my first deep dives into football analytics — a research project focused on identifying which passing concepts work best against different zone coverages in the NFL. The goal was to analyze trends in offensive success rates against Cover-2, Cover-3, and Cover-4 defenses, and to recommend strategic adjustments for teams facing those schemes.
Data Sources
- NFL tracking data
- Play-by-play data with coverage tags
- Publicly available player route and result data
Approach
- Collected play-by-play data and filtered for passing plays against Cover-2, Cover-3, and Cover-4 defenses.
- Calculated success rates and EPA (expected points added) for different passing concepts like verticals, flood, slant/flat, and mesh.
- Compared average EPA per concept against league averages by coverage type.
- Visualized which concepts consistently outperformed expectations against specific coverages.
Key Findings
- Flood and mesh concepts were especially effective against Cover-3 defenses.
- Verticals struggled against Cover-4 but performed well against Cover-2.
- Teams were often over-relying on certain concepts in unfavorable matchups, missing opportunities to exploit defensive tendencies.
Tools Used
- R, RStudio
ggplot2for data visualization
- Excel for data prep and manual coverage tagging
Takeaways
This was my introduction to working with football data and play-by-play analysis, and it gave me an early sense of how much nuance there is in matchup-based play calling. It also laid the foundation for later, more advanced NFL data projects I’ve worked on — including the NFL Big Data Bowl.
Visualizations